
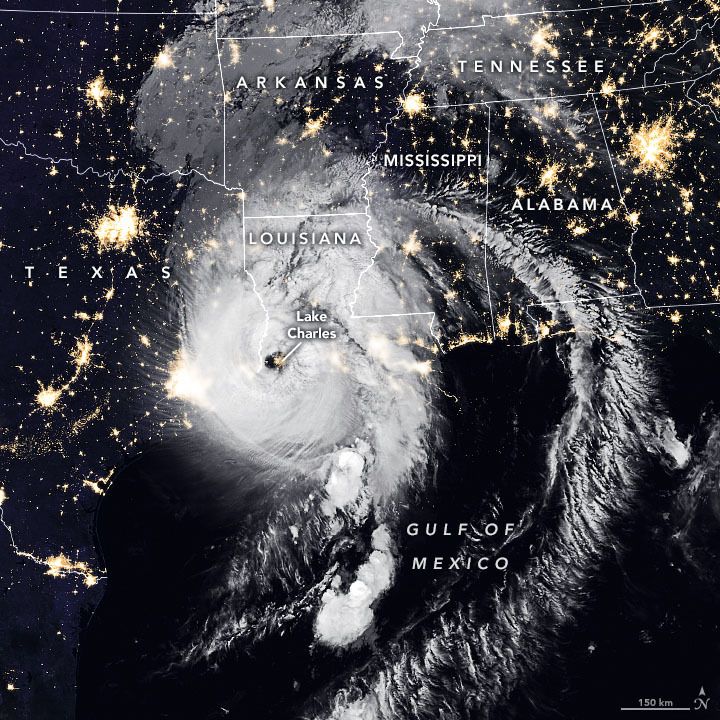
NASA Earth Observatory image by Joshua Stevens, using VIIRS data from NASA EOSDIS/LANCE and GIBS/Worldview and the Suomi National Polar-orbiting Partnership, and Black Marble data from NASA/GSFC.
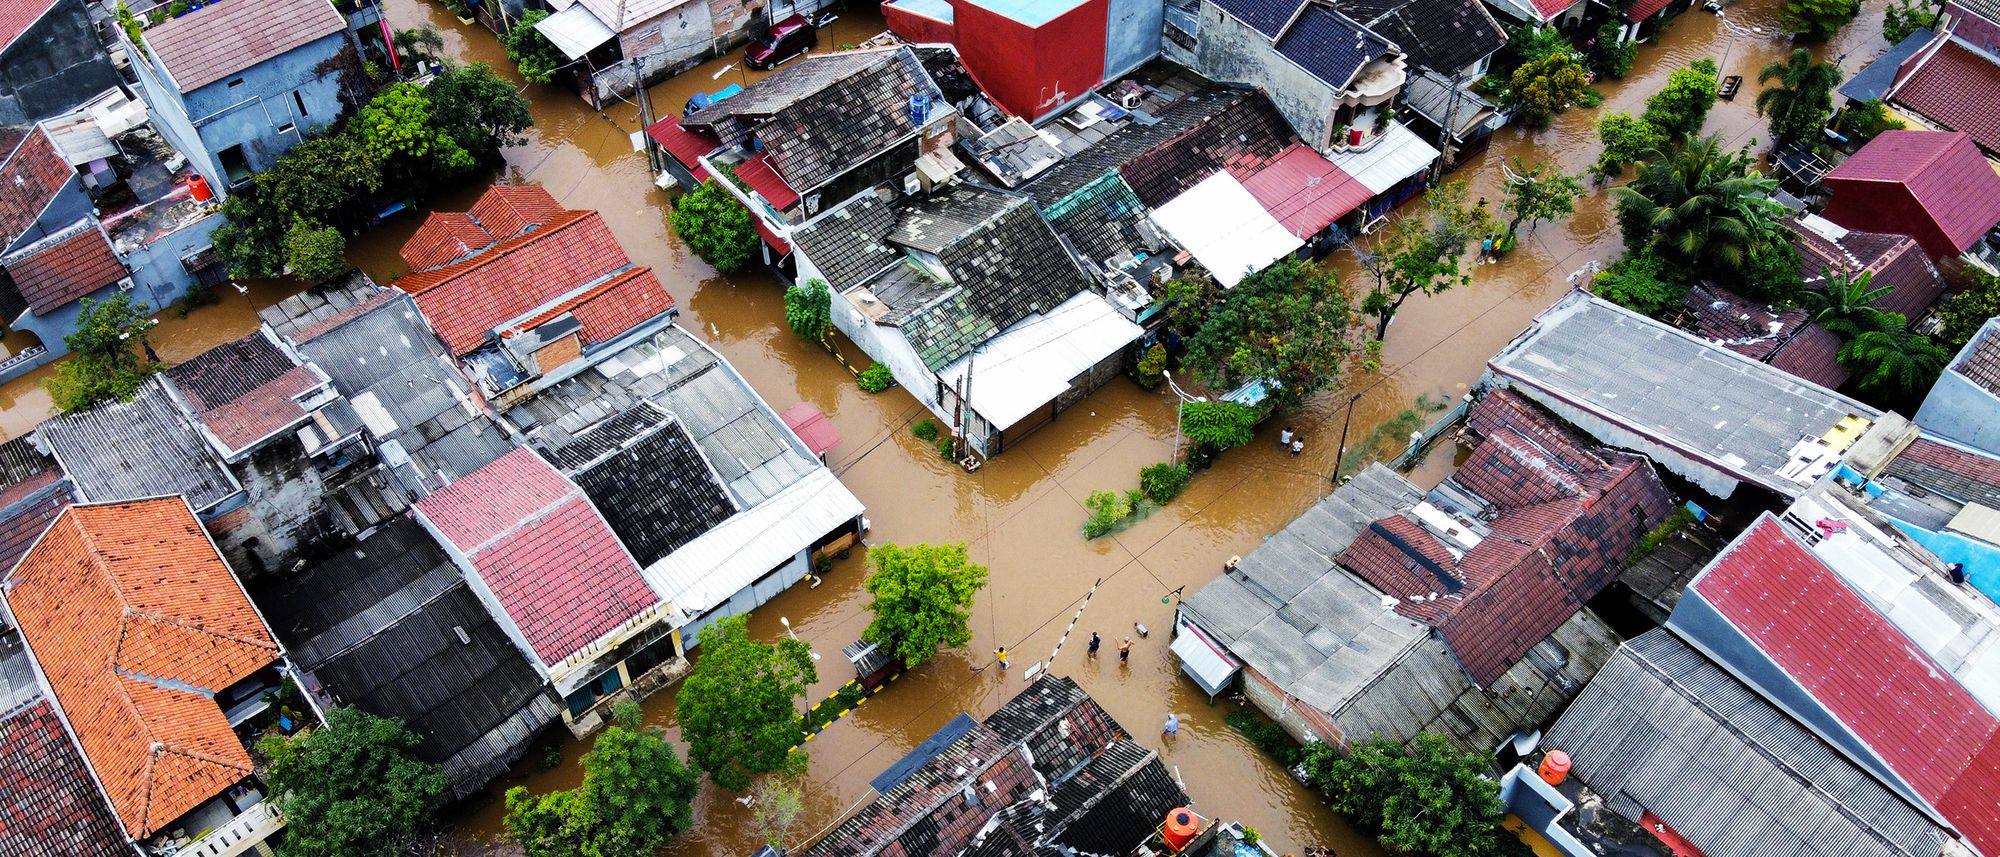
At 1am CDT on Thursday August 27th 2020, Hurricane Laura made landfall along the western Louisiana coastline as a Category 4 hurricane. An impactful storm in its own right, Laura is further stressing communities already dealing with COVID related challenges
At landfall, Laura was still one of the most powerful storms in U.S. history, leaving widespread destruction across the state resulted in:
- Sustained winds reaching 150mph;
- An observed wind gust of 154mph (at Holly Beach, LA), although it is likely that onshore wind gusts higher than this would have occurred (using WMO Guidelines, a gust of over 180mph could have reasonably occurred in the eyewall at landfall);
- A gust observed 30 miles inland (at Lake Charles, LA) of 137mph, implying sustained winds around 100mph or greater;
- A storm surge of up to 21 feet along parts of the Louisiana coastline, with the surge reaching up to 30-40 miles inland; and,
- Rainfall of up to 18 inches locally across parts of western Louisiana and eastern Texas.
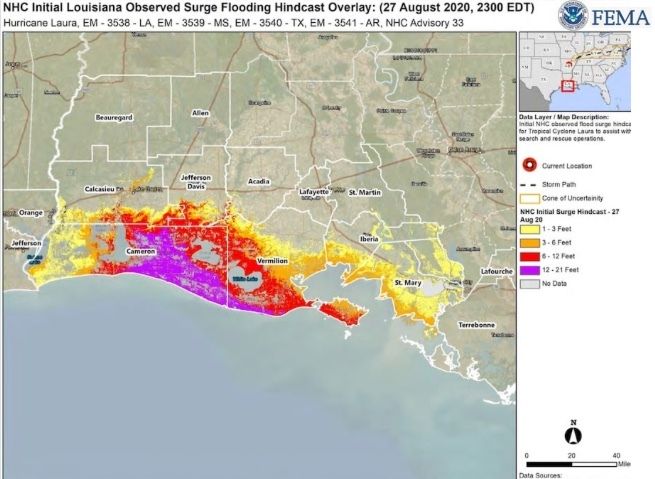
FEMA NRCC GIS as of 8/27/20 2300 EDT
The immediately visible impacts from Laura are sobering:
- 1.5 million people were under some form of evacuation order;
- Over 900,000 people lost power during the event;
- 10 days after the storm over 100,000 people in the Lake Charles area still lacked power or reliable water sources;
- At least 17 fatalities were attributed directly to the hurricane; and,
- A wide swath of damaged or destroyed residential, commercial, and industrial buildings.
As ever, the various modeling companies have attempted to assess the insured loss from this event. The results are tabulated below (onshore loss only, as of Sep 7, 2020):
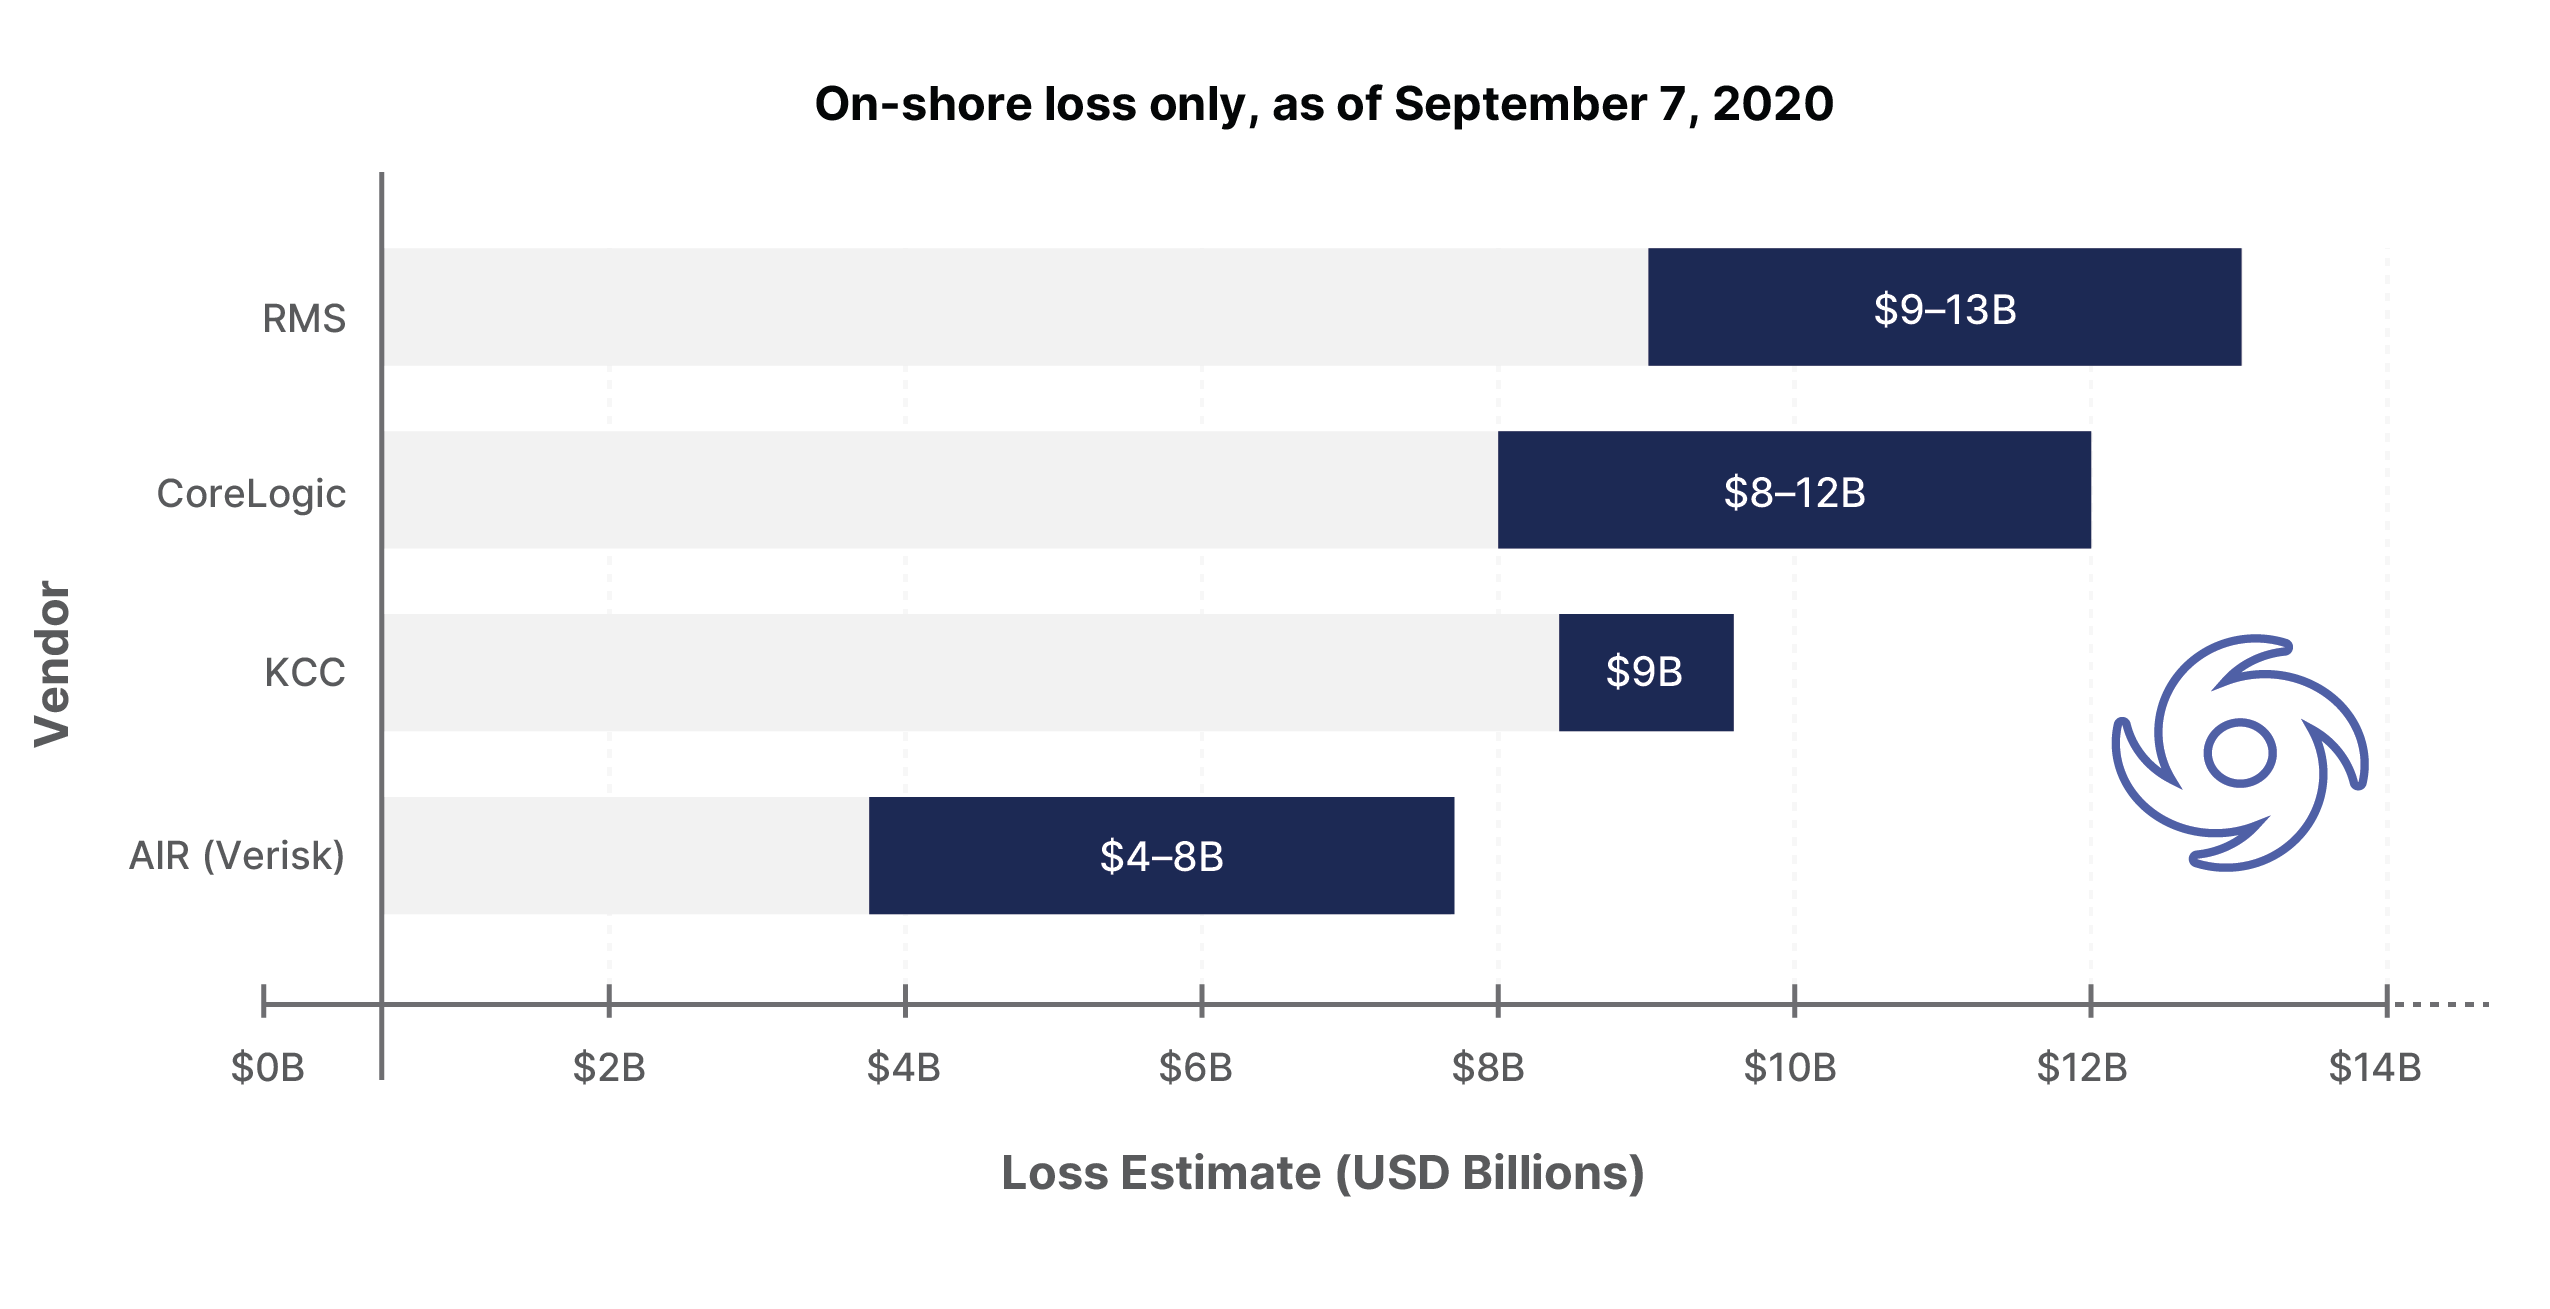
Clearly there is a wide disparity between the estimate and a relatively wide range for each estimate (apart from KCC’s point estimate). The $4-5B range in each estimate is large enough to get a whole hurricane inside (of note Hurricane Frances and Jeanne from 2004 both had final estimates of around $4B).
Why is there such inter- and intra-estimate disparity? After all, the physical characteristics of Laura are now known, and there is data to validate a wind swath and surge envelope against - there should be little controversy about the hazard created by Laura. So, if the hazard is a known, then the unknown must reside in how the hazard is translated into an insured loss.
Several years ago, JLT (now part of Guy Carpenter) examined this exact problem in the context of the 2017 storms (Harvey, Irma, Maria) and came to several conclusions:
- If the storm hit near a major city, the loss estimate was more uncertain;
- If the storm had ‘unusual’ characteristics, such as heavier precipitation or storm surge, the loss estimate was more uncertain; and,
- Loss adjustment expenses, contingent business interruption, and aggressive litigation, all contribute to increased uncertainty.
Catastrophe models: In the eye of the storm, JLT Viewpoint, July 2018
In the case of Laura, the first point doesn’t apply but the last two probably do. Additional costs associated with remediation may also be impacted by COVID related cost drivers and inefficiencies.
We believe the problem can be expressed slightly differently. If the hazard is known, then the unknowns must come from:
- Uncertainty on how a hazard and vulnerability manifest as a risk;
- Uncertainty about the assets (and their embedded vulnerabilities) on which the hazard is acting;
- Uncertainty around the insurance terms and conditions which each insured asset carries; and,
- Broader macroeconomic drivers and local pricing challenges (e.g. labor and materials shortages) impacting very large storms or disasters.
The lack of clarity around how hazards and vulnerabilities interact to drive losses is essentially an engineering problem, and one well known to the catastrophe modeling community - the use, and overuse, of damage/vulnerability functions which relate hazards (winds, flooding, ground shaking) to the percentage damage on a building of a given type. Vulnerability functions are a necessary abstraction which take engineering and insurance claims studies to create something which can be universally applied in a catastrophe model. They are, however, a very blunt instrument and can fail when used on a specific buildings as opposed to a generalised building.
Uncertainty around assets speaks to the lack of a consistent and complete database of properties which contain the necessary data points to characterise each risk. Insurers and agents commonly capture address, construction, occupancy type, building size, and roof type. Notwithstanding the large potential for errors to enter into this data (e.g. often mailing addresses are used, which may not be the physical address of a risk at all), there are other data elements which generally aren’t captured at all. For example, while distance to water may be captured, height above water may not be and both are crucial to understanding flood risk.
QOMPLX is addressing these gaps through our work on our cloud-native Hazard and Event Loss Modeling Platform (Q:HELM) and our complementary work on open data consolidation and curation using the Q:OS platform. QOMPLX’s unified data platform includes support for ad hoc scratchpad analytics, Spark and Flink based analytics, a range of data and analytics orchestration capabilities, and several types of pre-integrated hosted databases (e.g. relational, wide column, graph, timeseries) with a common data registry. The ongoing open data collection efforts at QOMPLX have demonstrated the potential of multi-source enrichment of catastrophe modeling using additional real estate and mortgage data to enhance the accuracy of overall catastrophe modeling initiatives relating to property risks. The team at QOMPLX is now working on additional offerings which will allow financial services companies and other bodies with a key interest in housing market activity and performance (including government bodies, universities, think-tanks, capital markets participants and re/insurers) opportunities to gain access to key metrics without having to host and manage the data themselves. This growing corpus of data includes a variety of mortgage, real estate and economic factors (e.g. employment, census, stimulus) and is designed to supplement cat modeling efforts by providing more of the helpful but usually missing data elements required by re/insurers and asset owners.
The lack of precision about insured risks applicable cover and interpretations during claims handling are, in many ways, a function of the uncertainty about asset characteristics. Each insured’s asset should be accompanied by the insurance terms and conditions for that insurance risk. However, these are often inaccurate or have non-standard terms and conditions which a modeler cannot interpret correctly. Furthermore, to come back to a point the JLT analysis made, issues like contingent BI and the impact of litigation are not easily captured, or not able to be captured, in traditional catastrophe modeling techniques. The use of agent-based models are more appropriate for these issues and the issues associated with the widespread supply side and demand side shocks that occur around major natural catastrophe events.
QOMPLX is helping to address these issues in a number of ways:
- A purpose built Contract Definition Language (CDL) is an insurance domain-specific language which allows the complete encapsulation of insurance terms and conditions for a risk, as well as a risk’s characteristics. Where the terms are known, or easily defined, the CDL captures them with no loss in fidelity. Where the terms are less easily defined, the CDL can be used in parametric studies to examine the ranges of outcomes given ‘fuzzy’ insurance terms. Furthermore, the CDL can be joined with real estate and other public records datasets to create more complete risk and insurance characterizations.
- Using the CDL as a base, our modeling platforms (Q:HELM for catastrophe modeling and QSIM for agent based modeling) can be used to simulate the multidimensional impacts from major catastrophic events - ranging from basic wind-generated losses, though to broader price dislocations in labor and materials due to both supply and demand shocks (LAE impacts), and onto consideration of long-term community viability and impacts to lenders and other related parties (e.g. climate impact on loans/mortgage books).
- QOMPLX’s agent-based modeling and simulation platform, QSIM, provides advanced tools for use cases like predicting the response of housing markets, credit markets or supply chains to various crises. Agent-specific models and data allow for parametric studies to consider a range of potential scenarios to identify critical weak links and provide guidance about model sensitivity. When combined with Q:HELM, QSIM can be used to help ascertain the long-term impacts and potential feedback loops between repetitive natural catastrophes (e.g. hurricanes or floods) on communities to aid insurers, banks, regulators, and other stakeholders in assessing ongoing challenges to their communities’ financial resilience and preparedness in a changing climate.

Interested in learning more?
Subscribe today to stay informed and get regular updates from QOMPLX.